OpenTelemetry is the standard way to collect traces, metrics, and logs in Node.js. This guide shows how to set up OpenTelemetry in Node.js with Express, export spans over OTLP, and extend those traces into background workflows with Inngest.
You will install @opentelemetry/sdk-node and @opentelemetry/exporter-trace-otlp-http, wire them to Jaeger or any OTLP collector, and link API requests to durable workflow spans you can inspect in Inngest Traces and Observability & Metrics.
The tutorial source code is available on GitHub.
What is OpenTelemetry tracing in Node.js?
OpenTelemetry tracing gives you end-to-end visibility of work triggered by users, APIs, webhooks, and background jobs. The core concepts:
- Trace: The full lifecycle of a request as it moves through your application.
- Span: A single unit of work inside a trace (for example, an Express handler or a database query).
- Distributed traces: Spans linked across components—such as an Express route that kicks off a background workflow.
Distributed tracing is especially useful when a Node.js app mixes HTTP handlers with queues, workers, or durable workflows. Without it, debugging means hopping between logs and guessing which step failed.
Set up OpenTelemetry in Node.js with @opentelemetry/sdk-node
Install the packages your Node.js app needs. If you are starting fresh, run npm init -y and set "type": "module" in package.json so ESM imports work.
Install @opentelemetry/sdk-node and related packages
npm install @opentelemetry/sdk-node @opentelemetry/api @opentelemetry/exporter-trace-otlp-http @opentelemetry/auto-instrumentations-node express inngest
What each package does:
@opentelemetry/sdk-node— Node.js OpenTelemetry SDK that registers the tracer provider and runs your instrumentations.@opentelemetry/exporter-trace-otlp-http— Sends spans to Jaeger, Grafana Tempo, Honeycomb, or any OTLP-compatible collector over HTTP.@opentelemetry/auto-instrumentations-node— Auto-instruments Express, HTTP, and common libraries (optional but recommended).- Express — Serves the example API.
- Inngest — Durable background workflows with Extended Traces.
Configure @opentelemetry/sdk-node
Create tracing.js and start the SDK before importing Express or other libraries you want instrumented:
// tracing.jsimport { NodeSDK } from "@opentelemetry/sdk-node";import { OTLPTraceExporter } from "@opentelemetry/exporter-trace-otlp-http";import { getNodeAutoInstrumentations } from "@opentelemetry/auto-instrumentations-node";import { InngestSpanProcessor } from "inngest/experimental";import { inngest } from "./workflow.js";// Configure OTLP endpoint for Jaeger (or your existing collector)// Override via OTEL_EXPORTER_OTLP_ENDPOINT or OTEL_EXPORTER_OTLP_TRACES_ENDPOINTconst traceExporter = new OTLPTraceExporter({url:process.env.OTEL_EXPORTER_OTLP_TRACES_ENDPOINT ||process.env.OTEL_EXPORTER_OTLP_ENDPOINT ||"http://localhost:4318/v1/traces",});const sdk = new NodeSDK({traceExporter,instrumentations: [getNodeAutoInstrumentations()],// Also export spans into Inngest Traces for workflow debuggingspanProcessors: [new InngestSpanProcessor(inngest)],serviceName: "nodejs-open-telemetry-example",});sdk.start();console.log("OpenTelemetry SDK started");console.log(`Tracing endpoint: ${process.env.OTEL_EXPORTER_OTLP_TRACES_ENDPOINT ||process.env.OTEL_EXPORTER_OTLP_ENDPOINT ||"http://localhost:4318/v1/traces"}`);
Export traces with @opentelemetry/exporter-trace-otlp-http
@opentelemetry/exporter-trace-otlp-http is the standard way to ship Node.js spans to an observability backend. Point it at:
- Local Jaeger:
http://localhost:4318/v1/traces - Your company collector: whatever OTLP HTTP URL your platform team provides
- A managed vendor that accepts OTLP
Prefer environment variables in production:
export OTEL_EXPORTER_OTLP_TRACES_ENDPOINT="https://otel-collector.example.com/v1/traces"# orexport OTEL_EXPORTER_OTLP_ENDPOINT="https://otel-collector.example.com"
The exporter in tracing.js already reads those variables, so the same code works locally and in production without edits.
Trace an Express API with OpenTelemetry
Create index.js. Import tracing.js first so instrumentation patches Express and fetch before they load:
// index.js// Import the tracing setup FIRST - must be before any other importsimport "./tracing.js";import express from "express";const app = express();const port = 3000;app.use(express.json());app.post("/users", async (req, res) => {const { name, email } = req.body;console.log(`Creating user: ${name}, ${email}`);// HTTP call shows up as a child span for demo purposesawait fetch("https://api.restful-api.dev/objects");res.status(201).send({ message: "User created successfully" });});// Example: curl -X POST http://localhost:3000/users \// -H "Content-Type: application/json" \// -d '{"name": "John Doe", "email": "john.doe@example.com"}'app.listen(port, () => {console.log(`User API listening at http://localhost:${port}`);});
With @opentelemetry/sdk-node and auto-instrumentations, Express handlers and outbound HTTP calls become spans without manual startSpan calls.
Trace background workflows with Inngest Extended Traces
Update the Express API to start an onboarding workflow when a user is created. Inngest lets you write durable workflows without standing up Redis, workers, or queues yourself:
// workflow.jsimport { Inngest } from "inngest";import { extendedTracesMiddleware } from "inngest/experimental";export const inngest = new Inngest({id: "nodejs-open-telemetry-example",name: "NodeJS Open Telemetry Example",// Provider is created in tracing.js; do not create a second one heremiddleware: [extendedTracesMiddleware({ behaviour: "off" })],});export const userOnboarding = inngest.createFunction({id: "user-onboarding",},{ event: "user.onboarding" },async ({ event, step }) => {console.log(`User onboarding: ${event.data.name}, ${event.data.email}`);await step.run("create-user", async () => {console.log(`Creating user: ${event.data.name}, ${event.data.email}`);await fetch("https://api.restful-api.dev/objects");return {name: event.data.name,email: event.data.email,};});await step.run("send-welcome-email", async () => {console.log(`Sending welcome email to: ${event.data.name}, ${event.data.email}`);return {name: event.data.name,email: event.data.email,};});});
Inngest Extended Traces capture workflow steps, database queries, and HTTP requests as OpenTelemetry spans. Full setup options (including @inngest/otel) are in the OpenTelemetry example docs.
Trigger the workflow from POST /users:
// index.js// ...import { serve } from "inngest/express";import { inngest, userOnboarding } from "./workflow.js";const app = express();const port = 3000;app.use(express.json());app.use("/api/inngest",serve({ client: inngest, functions: [userOnboarding] }));app.post("/users", async (req, res) => {const { name, email } = req.body;console.log(`Creating user: ${name}, ${email}`);await fetch("https://api.restful-api.dev/objects");await inngest.send({name: "user.onboarding",data: {name: name,email: email,},});res.status(201).send({ message: "User created successfully" });});// ...
Export Inngest traces to an existing OpenTelemetry collector
If you already run an OpenTelemetry collector (or a vendor OTLP endpoint), you do not need a second pipeline for Inngest. Keep your existing @opentelemetry/exporter-trace-otlp-http configuration and add Inngest’s span processor so the same Node.js provider exports:
- To your collector — via
OTLPTraceExporter(Jaeger, Tempo, Datadog agent, Grafana Alloy, etc.) - To Inngest Traces — via
InngestSpanProcessor, so step timelines show HTTP, DB, and custom spans next to queue delay and retries
Pattern for apps that already own OpenTelemetry:
import { NodeSDK } from "@opentelemetry/sdk-node";import { OTLPTraceExporter } from "@opentelemetry/exporter-trace-otlp-http";import { InngestSpanProcessor } from "inngest/experimental";import { inngest } from "./workflow.js";const sdk = new NodeSDK({// Existing collector URL — do not replace your platform exportertraceExporter: new OTLPTraceExporter({url: process.env.OTEL_EXPORTER_OTLP_TRACES_ENDPOINT,}),spanProcessors: [new InngestSpanProcessor(inngest)],serviceName: "nodejs-open-telemetry-example",});sdk.start();
On the Inngest client, set extendedTracesMiddleware({ behaviour: "off" }) when you add InngestSpanProcessor yourself, so the middleware does not create a second provider. Details are in the Extended Traces reference.
That dual-export setup is what “export Inngest traces to an existing OTel collector” means in practice: workflow spans ride your current OTLP path while remaining visible in the Inngest dashboard for run-level debugging.
Visualize OpenTelemetry spans in Jaeger
To visualize Express and Inngest spans locally, run Jaeger with OTLP enabled:
-
Start Jaeger (UI on
16686, OTLP on4317/4318):docker run --rm \-e COLLECTOR_ZIPKIN_HOST_PORT=:9411 \-p 16686:16686 \-p 4317:4317 \-p 4318:4318 \-p 9411:9411 \jaegertracing/all-in-one:latest -
Start the API and Inngest Dev Server:
npm startinngest dev -u http://localhost:3000/api/inngest --no-discovery -
Open Jaeger at
http://localhost:16686. -
Send a test request:
curl -X POST http://localhost:3000/users \-H "Content-Type: application/json" \-d '{"name": "John Doe", "email": "john.doe@example.com"}' -
In Jaeger, select the
nodejs-open-telemetry-exampleservice and click Find Traces. You should see the Express request and workflow steps in one distributed trace.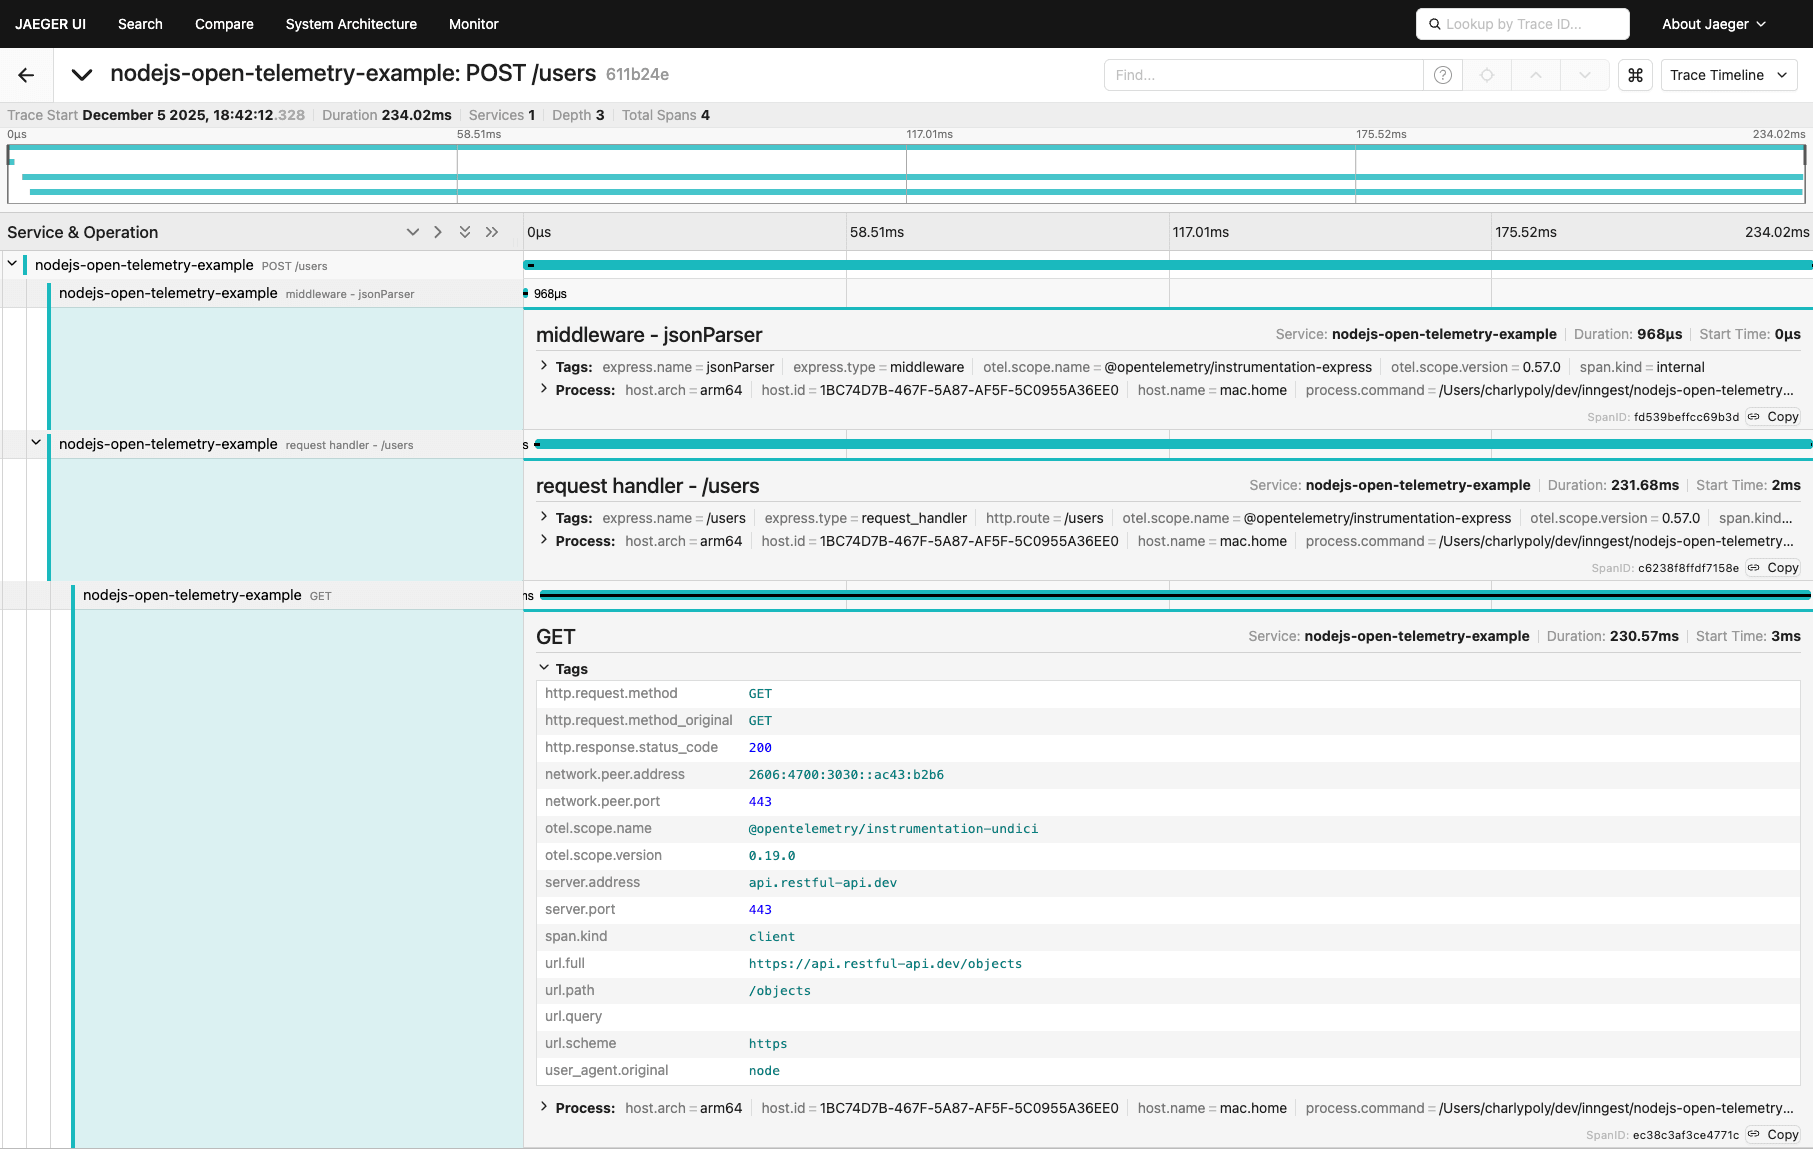
-
Bonus: open the Inngest Dev Server at
http://127.0.0.1:8288/runsto inspect the same run with step-level Traces: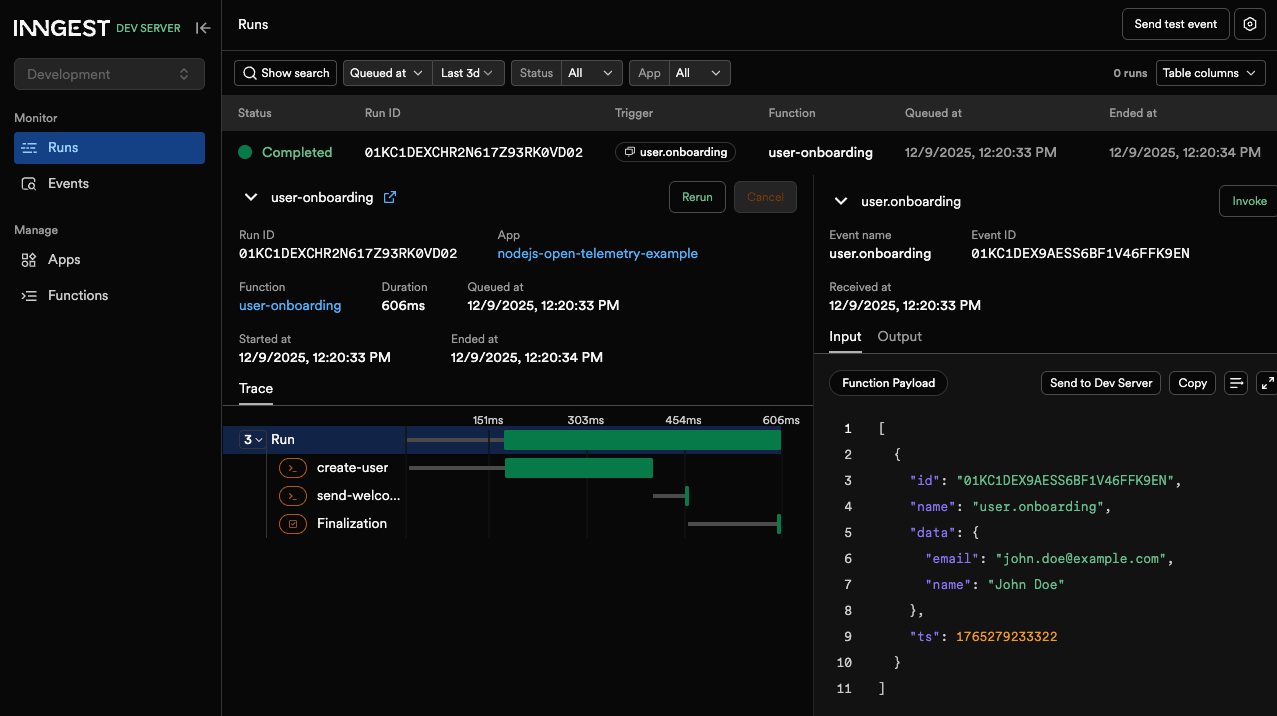
Monitor traces and metrics in Inngest
OpenTelemetry covers process-level spans. Inngest adds product observability on top:
- Traces — Interactive timeline per function run: queue delay, step duration, HTTP phases, retries, and Extended Traces / OTel spans.
- Observability & Metrics — Function volume, failure rate, and latency charts across apps without extra instrumentation.
Use Jaeger (or your collector) for fleet-wide search; use Inngest when you need to debug a specific durable run end to end.
Create custom spans in Node.js
Auto-instrumentation covers Express and many libraries, but you can still create custom spans with the OpenTelemetry API:
// index.js//...import { trace } from "@opentelemetry/api";//...app.post("/users", async (req, res) => {const { name, email } = req.body;console.log(`Creating user: ${name}, ${email}`);const tracer = trace.getTracer("user-api");const span = tracer.startSpan("create-user", {attributes: { "user.name": name, "user.email": email },});try {await fetch("https://api.restful-api.dev/objects");await inngest.send({name: "user.onboarding",data: {name: name,email: email,},});span.end();res.status(201).send({ message: "User created successfully" });} catch (error) {span.recordException(error);span.end();res.status(500).send({ message: "Error creating user" });}});//...
The same pattern works inside Inngest functions via the tracer argument from Extended Traces:
// workflow.js// ...export const userOnboarding = inngest.createFunction({ id: "user-onboarding" },{ event: "user.onboarding" },async ({ event, step, tracer }) => {const { name, email } = event.data;await step.run("create-user", async () => {tracer.startActiveSpan("create-user-request", async (span) => {span.setAttributes({ name, email });await fetch("https://api.restful-api.dev/objects");span.end();});});await step.run("send-welcome-email", async () => {// ...});});
FAQ: OpenTelemetry in Node.js
How do I set up OpenTelemetry in Node.js quickly?
Install @opentelemetry/sdk-node and @opentelemetry/exporter-trace-otlp-http, start a NodeSDK in a file imported before your app, and point the exporter at your OTLP endpoint.
How do I export OpenTelemetry traces from Node.js to Jaeger?
Use @opentelemetry/exporter-trace-otlp-http with http://localhost:4318/v1/traces (or OTEL_EXPORTER_OTLP_TRACES_ENDPOINT), then run Jaeger with OTLP enabled as shown above.
Does Express support automatic OpenTelemetry instrumentation?
Yes. With @opentelemetry/sdk-node and @opentelemetry/auto-instrumentations-node, Express handlers and middleware are traced without manual span creation.
How do I export Inngest workflow spans to my existing OTel collector?
Keep your existing OTLP exporter, add InngestSpanProcessor to the same provider, and set extendedTracesMiddleware({ behaviour: "off" }) on the Inngest client.
How do I trace background jobs and workflows in Node.js?
Use Inngest with Extended Traces so each step.run() and nested HTTP/DB work appears as spans, then send events from your API (/users) so the request and workflow share one distributed trace.
Next steps
- Sign up for Inngest and connect Extended Traces in a few minutes
- Read Traces and Observability & Metrics
- Follow the full OpenTelemetry + Inngest setup guide
- Clone the example repo and run the Jaeger walkthrough locally